ClickHouse behind the scenes: how we count visitors to librechat.ai
Our website analytics run on Plausible, with ClickHouse as the engine underneath. Why we built it that way, and what happens when you point a LibreChat agent at a few million pageviews and just ask it questions in plain English.

I run the infrastructure for LibreChat, including this site. I care about which pages get read, where traffic comes from, and whether a release actually showed up in the numbers. I don't care about tracking people across the web, and I really don't want a cookie banner as the first thing you see.
So librechat.ai uses Plausible. Open source, no cookies, no visitor profiles. The dashboard has the few metrics I actually look at. Fine. Not much to say about that part. The part worth writing about is what Plausible is sitting on.
- Unique visitors
- 111.5K
- Pageviews
- 409.2K
- Visits
- 125.3K
Counted by Plausible, stored in ClickHouse. No cookies, no cross-site tracking.
Those numbers aren't "in Plausible" the way people usually mean it. Plausible is the UI. The data lives in ClickHouse.
Why the storage engine matters here
Analytics is a weird workload. You shove in tons of tiny similar rows, almost never update them, then ask dumb-wide questions over everything: visits last week, top pages this month, which referrer won. Row-oriented databases are built for the other thing, full records in and out, and they start to feel it once the table gets big.
ClickHouse is columnar. Columns sit together on disk, so if a query only needs timestamp and pathname, it reads those two and ignores the rest. Similar values next to each other compress stupidly well. Our main events table is about 1.9 million rows in roughly 28 MiB on disk. That's the whole pageview history for the site. Aggregations over all of it usually come back in well under a second.
Cheap storage + fast scans is why Plausible puts events in ClickHouse and keeps the rest of the app on a normal relational DB.
The path a pageview takes
Open a page here and a ~1KB script fires one request. No cookie. Nothing that follows you to the next site. Plausible Community Edition takes the event, does session bookkeeping, writes it to ClickHouse.
Two stores, on purpose. Site config, logins, settings: PostgreSQL. Small relational stuff. Events and session rollups: ClickHouse. That side only grows. Once you've got a few million events in something this fast, the interesting bit isn't the dashboard charts anymore. It's that you can just... ask.
Asking it questions in plain English
I didn't expect this part to be fun. Plausible already does top pages, sources, visitors over time. Useful, but you're stuck with whatever chart someone already built.
Underneath it's a SQL table that happens to be fast. Ours is on ClickHouse Cloud, so I opened the console, selected the database, hit the ClickHouse Agents button, and started asking through the LibreChat integration they ship right in the console. Same idea as asking a coworker who already had the data open:
When is the best day to ship a release, and when are people actually around to see it?
You can watch it work. It picks tables, writes SQL, shows its work before the answer:
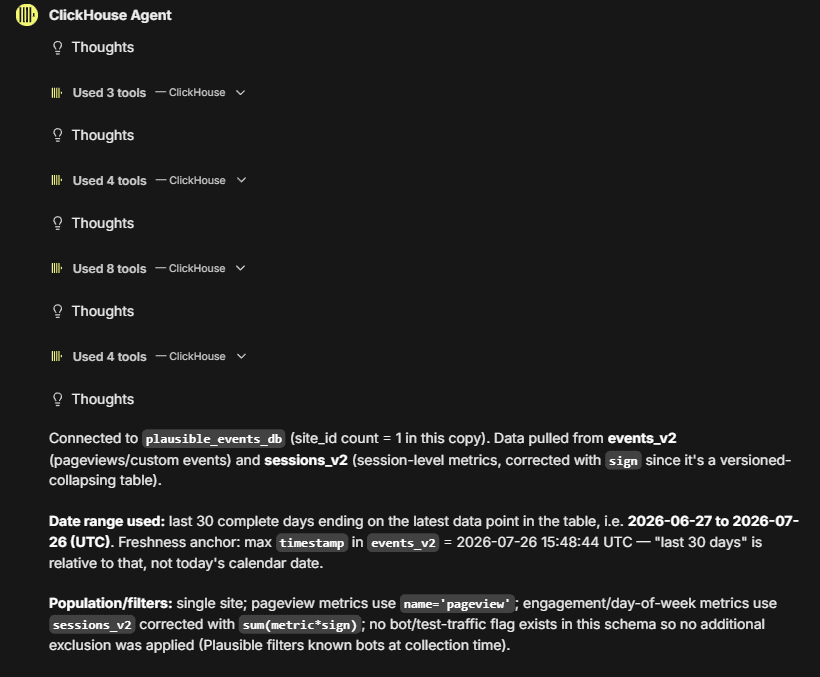
See the bit about correcting sessions_v2 with sign? That table uses +1 / -1 rows when a session gets amended. A plain count() is wrong. Nobody put that in the prompt. It looked at the schema, noticed a versioned collapsing table, and dealt with it.
Then the answer, in words:
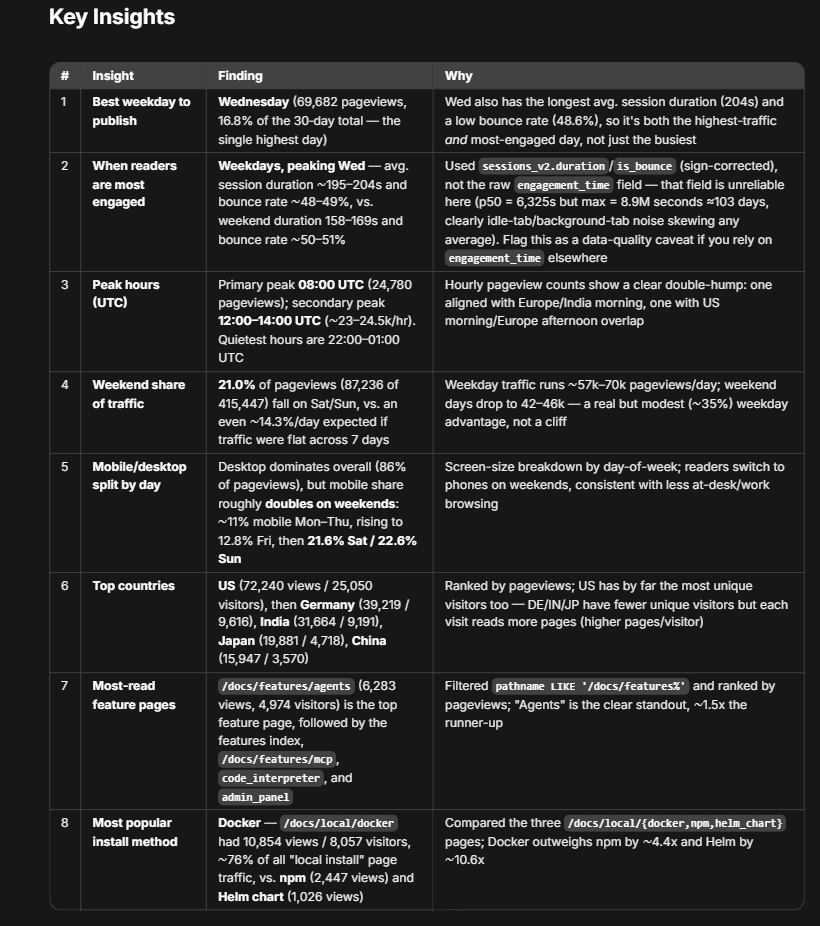
Same table as text, for screen readers and for anyone who hates reading screenshots:
| What I asked | What it found |
|---|---|
| Best weekday to publish | Wednesday: 69,682 pageviews, 16.8% of the month, and the longest sessions too |
| When readers are most engaged | Weekdays, peaking Wednesday. Sessions run ~195–204s, against 158–169s at the weekend |
| Peak hours | A spike at 08:00 UTC, a second one 12:00–14:00. Deadest between 22:00 and 01:00 |
| Weekend share | 21% of pageviews land on Sat/Sun (87,236 of 415,447) — a real dip, but not a cliff |
| Mobile vs desktop | ~11% mobile Mon–Thu, jumping to 21.6% on Saturday and 22.6% on Sunday |
| Top countries | US first (72,240 views), Germany a clear second (39,219), then India, Japan, China |
| Most-read feature pages | /docs/features/agents at 6,283 views, about 1.5× the runner-up, with MCP close behind |
| Most popular install method | Docker, at 10,854 views: roughly 4.4× npm and 10.6× the Helm chart |
I didn't build any of that. Asked a question, it scanned a few million rows, answered while I was still reading. That's why this is ClickHouse and not a CSV, and not a DB that falls over around a million rows. Prompts are at the end if you want to try it on your own instance.
Best bit was something I never asked. Mid-answer it points out that engagement_time is trash: median ~6,300 seconds, max 8.9 million (about 103 days on one page). Someone left a tab open. Every "average engagement" number you might quote is garbage because of it. So it dropped the column, used session duration instead, and told me to go fix the data. Fair.
What it doesn't know about you
Look at that list again. Release day, peak hours, weekend mobile, Germany second. All whole-audience stuff. None of it needs to know who you are.
Plausible doesn't set a cookie, doesn't hand out a sticky ID, doesn't trail you elsewhere. There's no "you" row in that ClickHouse table. The agent can say the Docker docs are busy on a Saturday morning without knowing it was your browser.
I keep hearing this sold as a trade-off: either real analytics or leave people alone. The table above is me saying no, you can have useful traffic insight without building profiles.
Where this is going
Slightly weird timing for this post. We've been using ClickHouse for site analytics for a while. Recently LibreChat and ClickHouse started working together more directly; there's a banner about it at the top of this page. The same database that's been counting pageviews is becoming part of LibreChat itself.
A month ago we moved the whole analytics store onto a new ClickHouse Cloud cluster. Took an afternoon, ~5 minutes of downtime. Boring, which is what you want from a database migration. Every number in this post came back out of the new cluster.
Top-of-page stats: counted without cookies, stored somewhere a few million events barely matter, and close enough that you can just ask in English.
The prompts
If you want the same setup: ClickHouse Cloud console, select your DB, open ClickHouse Agents (LibreChat is wired in there). These instructions work as a starting point.
Agent instructions:
You have read-only access to our Plausible analytics in ClickHouse (database
plausible_events_db;events_v2holds pageviews and events,sessions_v2holds sessions). Only run read queries. Answer with whole-audience aggregates only, never anything that could single out a visitor. Prefer clear takeaways and small tables over raw rows, and always say which date range you used.
The weekly digest that produced the table above:
From the last 30 days of
events_v2andsessions_v2, give me a "Key Insights" table: best weekday to publish, when readers are most engaged, peak hours in UTC, the weekend share of traffic, the mobile/desktop split by day, top countries, the most-read feature pages, and the most popular install method. One row per insight, with a short "why."
Best time to ship:
What day and hour (UTC) should I publish a release to reach the most engaged readers? Use the last 8 weeks of sessions, weight by average session duration, and show the top three windows.
A shareable, privacy-safe snapshot:
Write a short public traffic summary I can post: total visits, pageviews, top 5 pages, and top 5 countries for last month. Whole-audience numbers only.
Plausible Community Edition v3.2.1 · ClickHouse 26.2 · librechat.ai.